Now that we have the hardware and OS setup (see part 1), we can start running the node. I wanted to first run the node without staking, so I could get a feel for the node and make mistakes in a low stakes environment.
Running a node essentially means running the software that makes up the node. For Ethereum, there are two pieces of software:
- Execution client
- Also known as the "execution engine"
- The excecution client is responsible for listening to new transactions broadcasted on the network and validating them. It also stores the state of the chain.
- Consensus client
- Also known as the "beacon node"
- The consensus client is responsible for achieving consensus on the state of the chain, ie the validated data from the execution client. It implements the proof of stake consensus algorithm.
- The consensus client is also the one that can participate in securing the network (ie proposing new blocks, voting, etc.). This is where you stake and earn rewards!
- This is the piece we won't be running as we're not staking.
0. Picking Clients
Now both execution clients and consensus clients are available in a variety of programming languages developed by different teams. They all follow the same protocol specs, but have different implementations. The spec was originally defined in the Ethereum yellow paper, but now has its own specs page and EIPs:
There is also an option on installing a single piece of software that combines both the execution and consensus client, and gives you a nice GUI to configure and manage your node. But again to not add more abstractions, I'm using two separate pieces of software.
After comparing the different clients, I'm decided to use Reth as my execution client and Lighthouse as my consensus client. I wanted to pick a client that was actively maintained, had a good community, and was resource efficient. For client diversity, it's also important to use clients that don't make up the majority of the network.
Here's a good page to see the current client diversity.
1. Installing Clients
I followed the instructions on the Reth installation page and Lighthouse installation page.
I'm used to Homebrew from using a Mac so added it to the Linux machine.
/bin/bash -c "$(curl -fsSL https://raw.githubusercontent.com/Homebrew/install/HEAD/install.sh)"Reth:
brew install paradigmxyz/brew/rethTesting the installation:
reth --versionreth Version: 1.1.5
Commit SHA: 3212af2d85a54eb207661361ac9fe1d7de4b5b8e
Build Timestamp: 2025-01-07T09:15:15.000000000Z
Build Features: asm_keccak,jemalloc
Build Profile: releaseLighthouse:
cd ~
curl -LO https://github.com/sigp/lighthouse/releases/download/v6.0.1/lighthouse-v6.0.1-x86_64-unknown-linux-gnu.tar.gz
tar -xvf lighthouse-v6.0.1-x86_64-unknown-linux-gnu.tar.gz
sudo cp lighthouse /usr/bin
Testing the installation:
lighthouse --versionLighthouse v6.0.1-0d90135
BLS library: blst-portable
BLS hardware acceleration: true
SHA256 hardware acceleration: true
Allocator: jemalloc
Profile: maxperf
Specs: mainnet (true), minimal (false), gnosis (true)2. Running The Clients
Again simply following the Reth guide and Lighthouse guide.
sudo mkdir -p /secrets
openssl rand -hex 32 | tr -d "\n" | sudo tee /secrets/jwt.hex
In one terminal:
reth node \
    --full \
    --authrpc.jwtsecret /secrets/jwt.hex \
    --authrpc.addr 127.0.0.1 \
    --authrpc.port 8551 \
    --http \
    --http.addr 127.0.0.1 \
    --http.port 8545 \
    --http.api eth,web3,net,trace \
    --ws \
    --ws.addr 127.0.0.1 \
    --ws.port 8546 \
    --ws.api eth,web3,net,trace \
    --metrics 127.0.0.1:9001
In another terminal:
lighthouse bn \
    --network mainnet \
    --execution-endpoint http://localhost:8551 \
    --execution-jwt /secrets/jwt.hex \
    --checkpoint-sync-url https://mainnet.checkpoint.sigp.io \
    --disable-deposit-contract-sync \
    --metrics
Important Notes
- I chose to sync mainnet as there's no risk of losing funds
- I chose to run a full node as I didn't want any trust assumptions. See other options here.
- The main parameter in lighthouse if you're not staking is
--disable-deposit-contract-sync. - I've enabled both http and ws on the reth node as that's what most common applications use
- I've enabled metrics on both nodes
- U've set the addr to
127.0.0.1so by default it'll only be accessible on the server. If you want it to be accessible from any device on your network, then you need to change this to0.0.0.0
You'll know if things are working correctly when you see logs indicating that the node is syncing. You should see logs updating for both clients.
You can check if the Reth node is synced by running:
curl -X POST http://localhost:8545 -H "Content-Type: application/json" -d '{ "jsonrpc": "2.0", "method": "eth_syncing", "params": [], "id": 1 }'If it returns the following, then the node is synced:
{
  "jsonrpc": "2.0",
  "id": 1,
  "result": false
}
3. Using the Node
It took ~5 days to sync the full node and ~1.2 TB of storage was used up.
After that I was able to use the node via the HTTP and WS endpoints.
curl -X POST http://localhost:8545 -H "Content-Type: application/json" -d '{ "jsonrpc": "2.0", "method": "eth_blockNumber", "params": [], "id": 1 }'{
"jsonrpc": "2.0",
"id": 1,
"result": "0x14ae2fa"
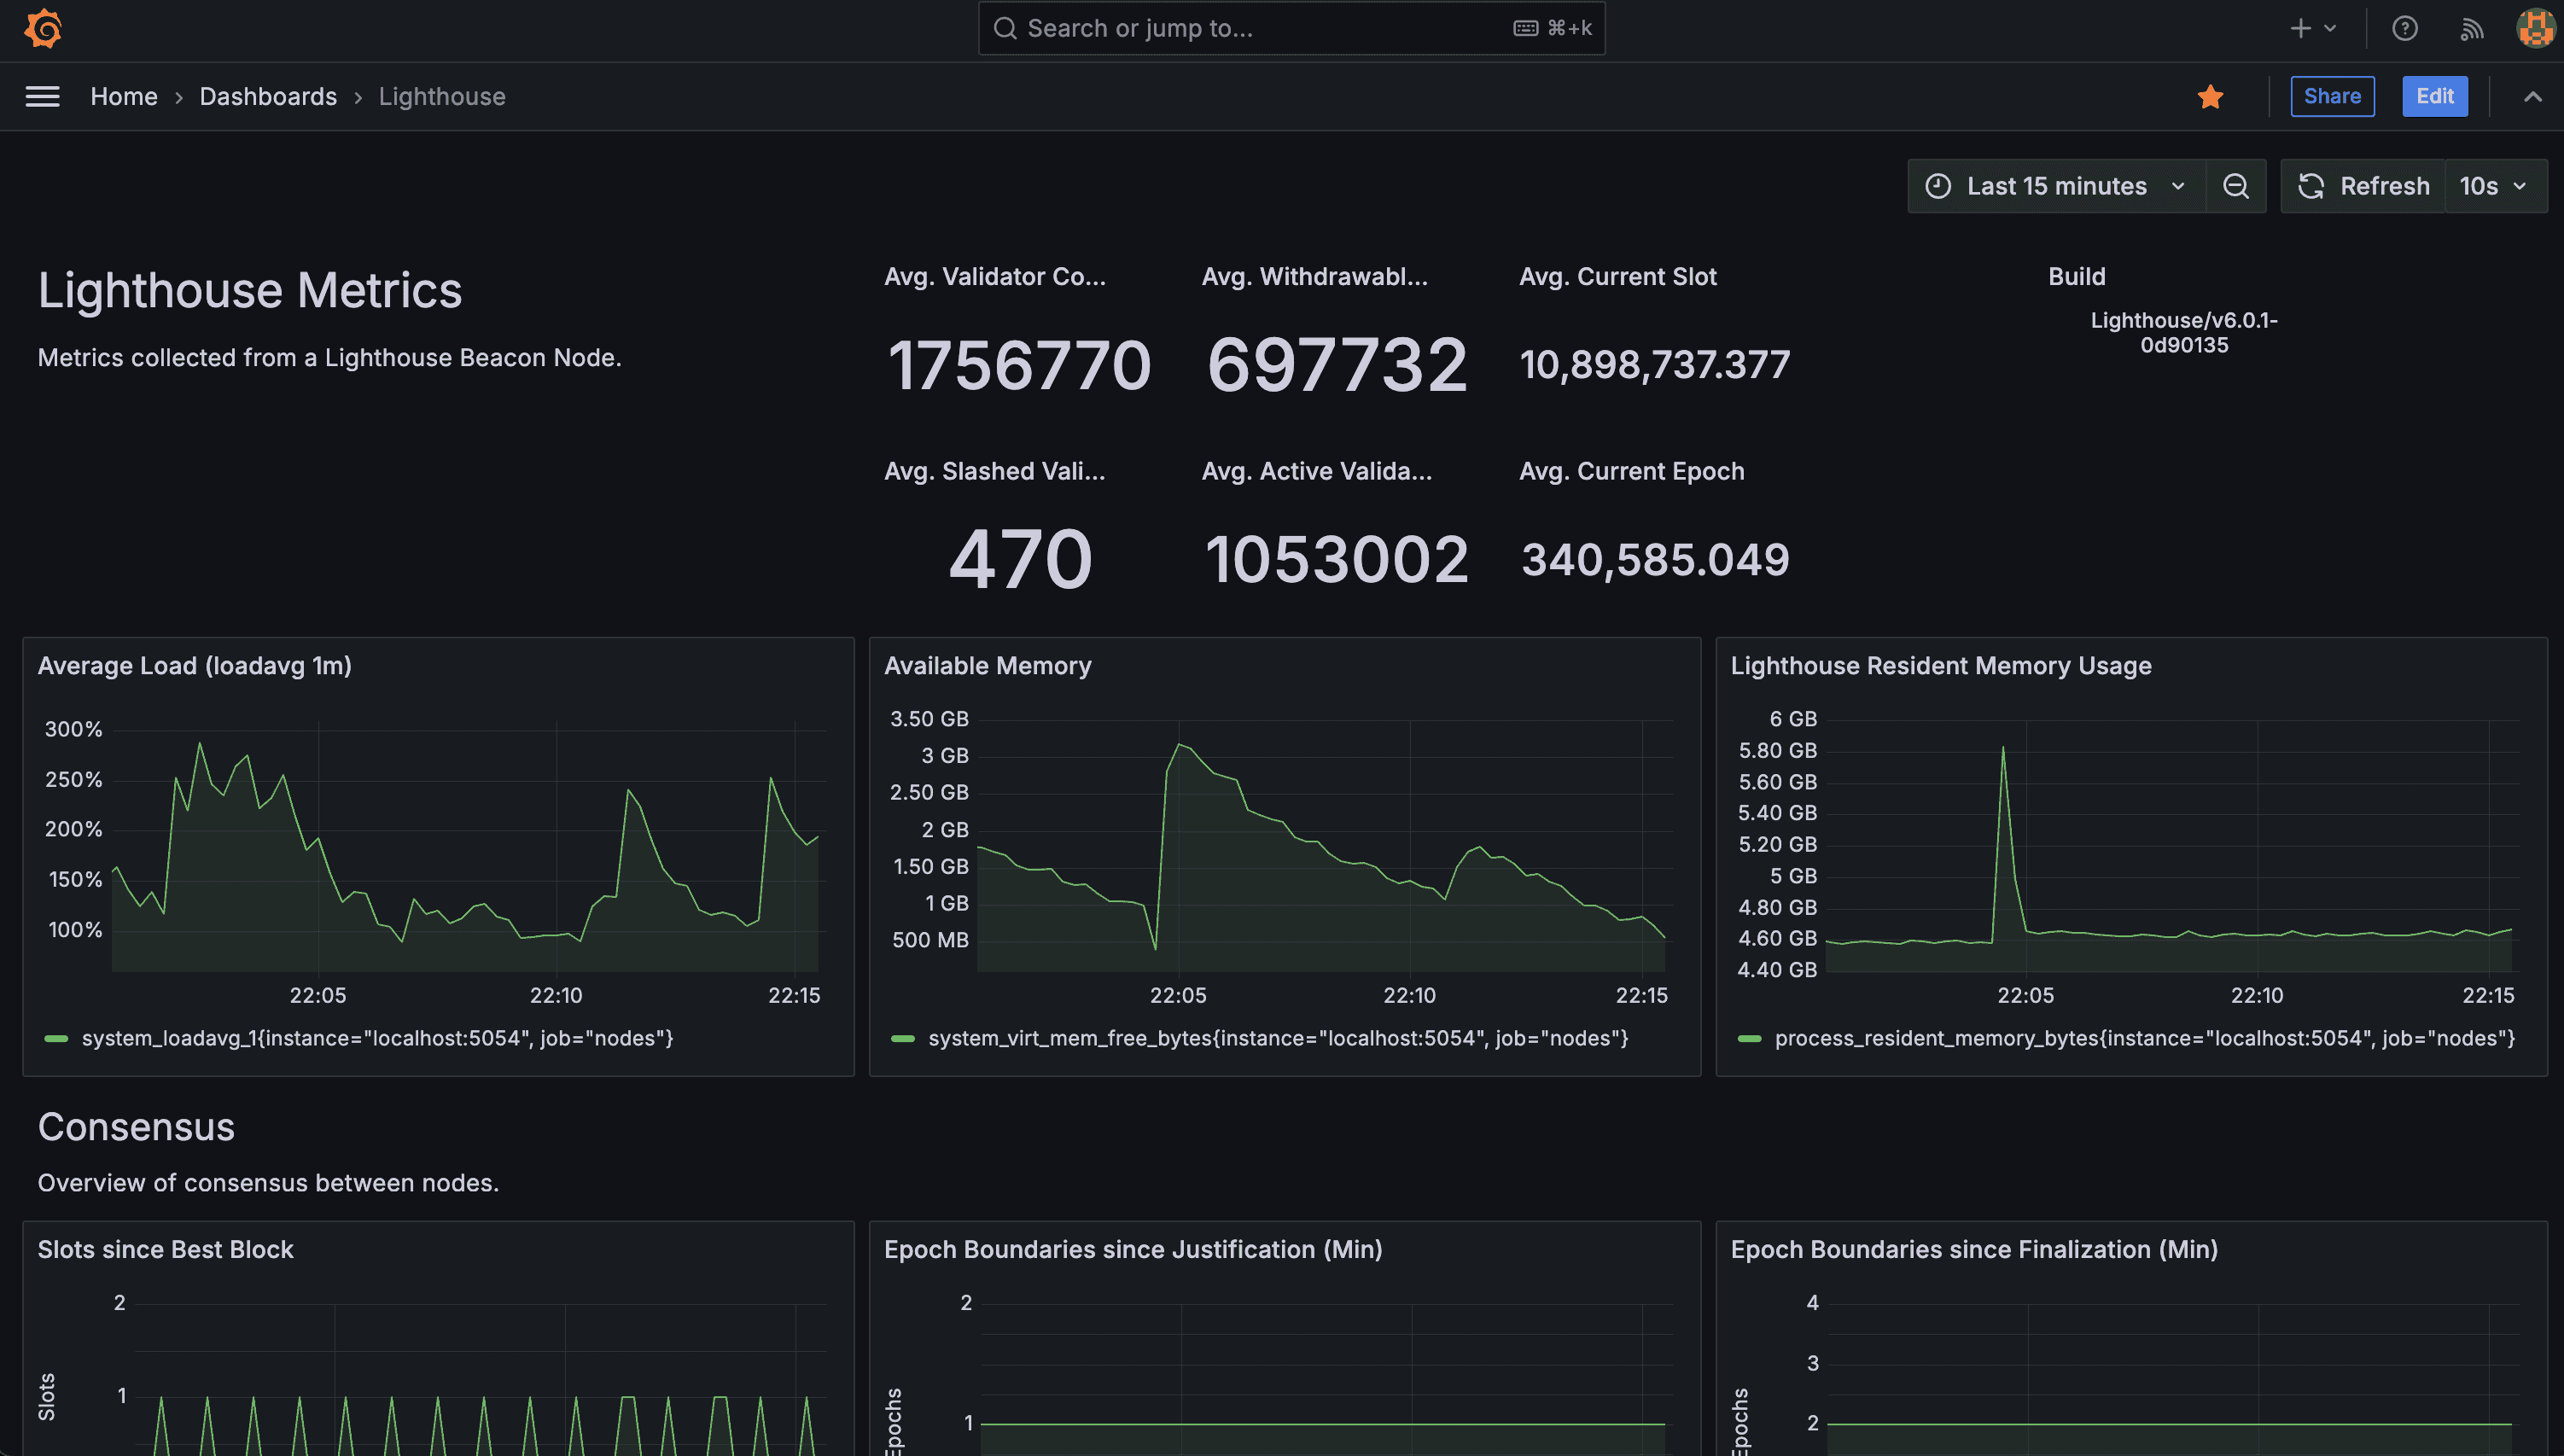
}4. Monitoring
Okay hooray! We've got an Ethereum mainnet node running! We're now independently verifying the state of the chain and can use it for any applications that require a node.
The next step is to monitor the node. I'm using Prometheus and Grafana to monitor the node.
Again, Reth has a great guide on how to set up metrics. Lighthouse also provides a Prometheus export format.
First, ensure metrics are enabled on both clients:
curl 127.0.0.1:9001
curl 127.0.0.1:5054/metrics
Then setup prometheus and grafana:
brew update
brew install prometheus
brew install grafana
brew services start prometheus
brew services start grafana
For lighthouse, create this file /home/linuxbrew/.linuxbrew/etc/prometheus/targets/scrape-targets.json, with the following from the Lighthouse github:
[
  {
    "labels": {
      "job": "nodes"
    },
    "targets": [
      "localhost:5054",
      "localhost:5064"
    ]
  }
]
My final Prometheus config in /home/linuxbrew/.linuxbrew/etc/prometheus.yml
scrape_configs:
  - job_name: reth
    metrics_path: "/"
    scrape_interval: 5s
    static_configs:
      - targets: ['reth:9001', 'localhost:9001', 'host.docker.internal:9001']
  - job_name: ethereum-metrics-exporter
    metrics_path: "/metrics"
    scrape_interval: 5s
    static_configs:
      - targets: ['metrics-exporter:9091']
  - job_name: 'local-lighthouse'
    scrape_interval: 5s
    file_sd_configs:
      - files:
        - '/home/linuxbrew/.linuxbrew/etc/prometheus/targets/scrape-targets.json'
Then follow the rest of the steps in the Reth guide to setup Grafana.
At the end you should have a Prometheus data source and two dashboards using the following files:
Reth Dashboard
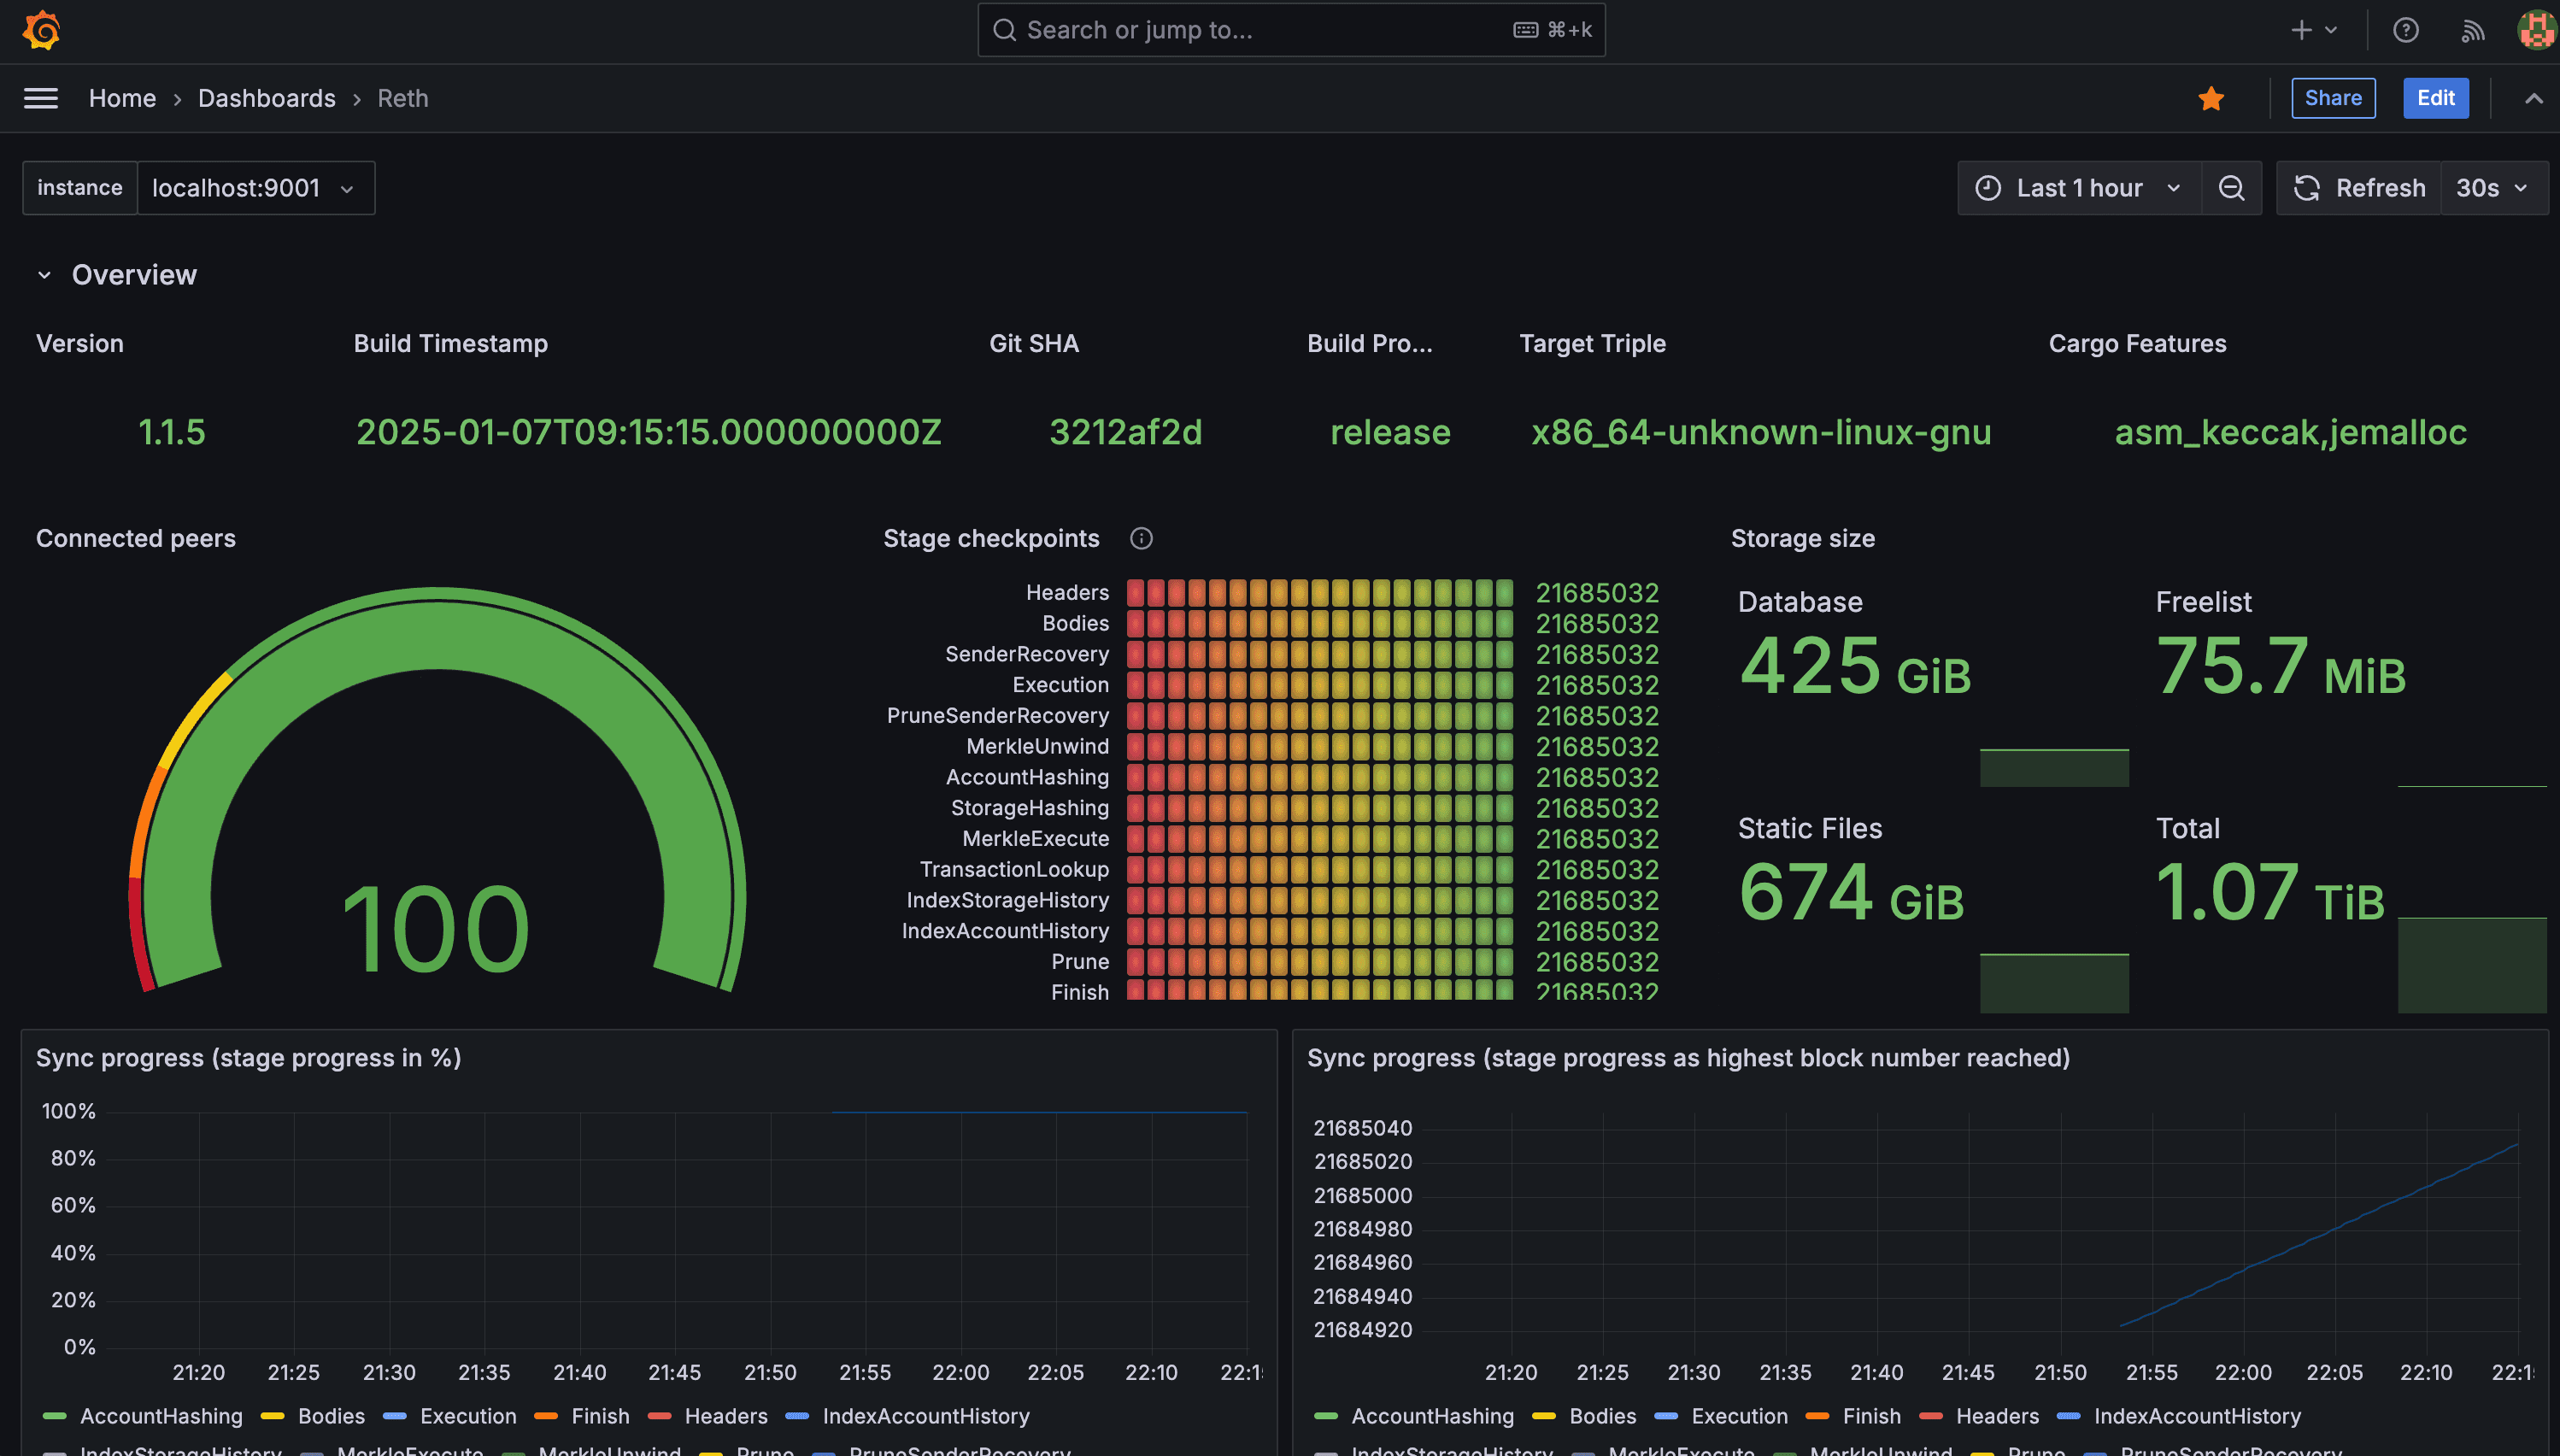
Lighthouse Dashboard
5. Running in Background
Next, we want the nodes to run in the background so we don't need to keep the terminals open, and also for it to auto restart if it crashes, or if the PC restarts.
To do this, we can create a systemd service for each client.
Config file for the Reth service: /etc/systemd/system/reth.service
[Unit]
Description=Reth
After=network.target
StartLimitIntervalSec=0

[Service]
Type=simple

Restart=always
RestartSec=1

User=dhvanipa
Group=dhvanipa

ExecStart=/home/linuxbrew/.linuxbrew/bin/reth node \
    --full \
    --authrpc.jwtsecret /secrets/jwt.hex \
    --authrpc.addr 127.0.0.1 \
    --authrpc.port 8551 \
    --http \
    --http.addr 127.0.0.1 \
    --http.port 8545 \
    --http.api eth,web3,net,trace \
    --ws \
    --ws.addr 127.0.0.1 \
    --ws.port 8546 \
    --ws.api eth,web3,net,trace \
    --metrics 127.0.0.1:9001

StandardOutput=journal
StandardError=journal

[Install]
WantedBy=multi-user.target
Config file for the Lighthouse service: /etc/systemd/system/lighthouse.service
[Unit]
Description=Lighthouse
After=network.target
StartLimitIntervalSec=0

[Service]
Type=simple

Restart=always
RestartSec=1

User=dhvanipa
Group=dhvanipa

ExecStart=/usr/bin/lighthouse bn \
    --network mainnet \
    --execution-endpoint http://localhost:8551 \
    --execution-jwt /secrets/jwt.hex \
    --checkpoint-sync-url https://mainnet.checkpoint.sigp.io \
    --disable-deposit-contract-sync \
    --metrics

StandardOutput=journal
StandardError=journal

[Install]
WantedBy=multi-user.target
Then:
sudo systemctl daemon-reload
sudo systemctl start reth
sudo systemctl start lighthouse
sudo systemctl enable reth
sudo systemctl enable lighthouse
sudo systemctl status reth
sudo systemctl status lighthouse
To view the logs now:
sudo journalctl -u reth -f
sudo journalctl -u lighthouse -f
Conclusion
Finally, we've got an Ethereum mainnet node running in the background that's fully synced with monitoring setup!
We are now verifying the state of the chain, but not contributing to decentralization as other nodes can't talk to us. To enable that we'd need to open up the following ports:
- Execution client:
30303 - Consensus client:
9000
However, we'll do that together with enabling staking in the next part.
Bonus: Accessing the Server from Anywhere
I can privately access my node if I'm on the same network, but I want to be able to access it from anywhere. One option is to enable port forwarding on the router, but this has security risks.
Instead, I'm going to use Tailscale to access the server via a VPN. It's free for personal use and easy to setup. I simply followed the onboarding and got the GUI client for my laptop. Then for the server, followed the instructions here.
After this, I tested connecting to my node from my mobile data instead of the wifi network, and it worked!